Refer to the information provided in Scenario 1 below to answer the following questions.
SCENARIO 1: The following diagram represents the U.S. market for oil. 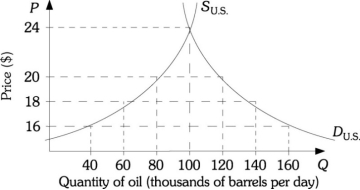
-Refer to Scenario 1. Use the total revenue test (on all oil sold) to determine elasticity of demand with a price drop from $18 to $16.
Correct Answer:
Verified
View Answer
Unlock this answer now
Get Access to more Verified Answers free of charge
Q12: Assume that that the two graphs below
Q13: What does it mean for a good
Q14: The price elasticity of demand for gasoline
Q15: Why isn't slope as useful as elasticity
Q16: Define price elasticity of demand. What does
Q18: Compare and contrast the two demand curves
Q19: The price elasticity of demand for new
Q20: If the price elasticity of demand for
Q21: Assume you are working at a department
Q22: What is the midpoint formula for calculating
Unlock this Answer For Free Now!
View this answer and more for free by performing one of the following actions

Scan the QR code to install the App and get 2 free unlocks

Unlock quizzes for free by uploading documents