The diagram below shows the demand and supply curves in a perfectly competitive market. 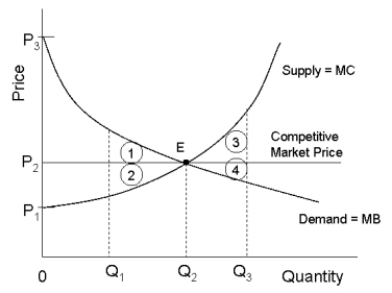 FIGURE 12-5
-Refer to Figure 12-5. If output in this market were Q₁, the total loss in economic surplus relative to the competitive equilibrium would be illustrated by area
A) P1P3E.
B) 1 + 2 + 3 + 4.
C) 1.
D) 2.
E) 1 + 2.
Correct Answer:
Verified
Q21: The diagram below shows supply, demand, and
Q24: Productive efficiency for an individual firm requires
Q25: An allowable defense for a merger according
Q32: Which of the following is the definition
Q33: The diagram below shows supply, demand, and
Q35: Canadian governments (federal, provincial and municipal) employ
Q36: The diagram below shows supply, demand, and
Q38: Consumer surplus represents
A) the marginal value that
Q39: Which of the following is an example
Q39: The diagram below shows the market demand
Unlock this Answer For Free Now!
View this answer and more for free by performing one of the following actions

Scan the QR code to install the App and get 2 free unlocks

Unlock quizzes for free by uploading documents