The diagram below shows the market demand curve and the cost curves for a single firm. 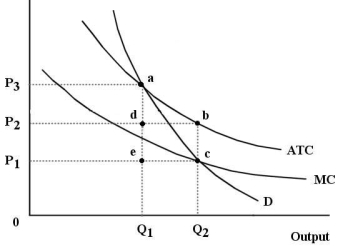 FIGURE 12-6
-Refer to Figure 12-6. Suppose this firm is being regulated using the policy of marginal-cost pricing.The resulting price and output would be
A) P1 and Q₂.
B) P2 and Q₂.
C) P1 and Q₁.
D) P3 and Q₂.
E) P3 and Q₁.
Correct Answer:
Verified
Q31: The diagram below shows cost and revenue
Q32: Which of the following is the definition
Q34: The diagram below shows the demand and
Q36: The diagram below shows supply, demand, and
Q38: Consumer surplus represents
A) the marginal value that
Q39: Which of the following is an example
Q42: The diagram below shows the demand and
Q44: demand curve to shift to the left.
A)
Q51: We can safely say that each point
Q58: An economy will be allocatively efficient if
A)
Unlock this Answer For Free Now!
View this answer and more for free by performing one of the following actions

Scan the QR code to install the App and get 2 free unlocks

Unlock quizzes for free by uploading documents