The diagram below shows the demand and supply curves in a perfectly competitive market. 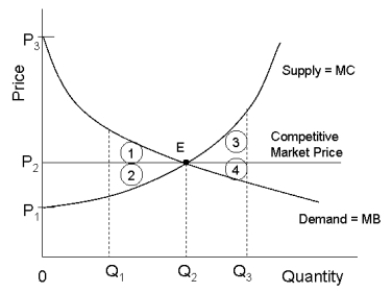 FIGURE 12-5
-Refer to Figure 12-5. If output in this market were Q₁, and the price were still equal to itsfree-market level, the loss in producer surplus relative to the competitive equilibrium would be illustrated by area
A) P3P2E.
B) P1P3E.
C) 2.
D) 1.
E) 1 + 2.
Correct Answer:
Verified
Q31: The diagram below shows cost and revenue
Q36: The diagram below shows supply, demand, and
Q39: The diagram below shows the market demand
Q39: Which of the following is an example
Q43: The diagram below shows the market demand
Q44: demand curve to shift to the left.
A)
Q45: The diagram below shows the market demand
Q51: We can safely say that each point
Q58: An economy will be allocatively efficient if
A)
Q59: A major aim of Canadian competition policy
Unlock this Answer For Free Now!
View this answer and more for free by performing one of the following actions

Scan the QR code to install the App and get 2 free unlocks

Unlock quizzes for free by uploading documents