The diagram below shows the market demand curve and the cost curves for a single firm. 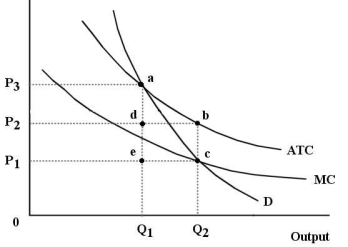 FIGURE 12-6
-Refer to Figure 12-6. Suppose this firm is being regulated using a policy of average-cost pricing. In this case, economic profits to the firm are represented by the area
A) P2P3ad
B) P1P2bc
C) 0P3aQ₁
D) P2P3ab
E) there are no economic profits.
Correct Answer:
Verified
Q31: The diagram below shows cost and revenue
Q42: The diagram below shows the demand and
Q43: The diagram below shows the market demand
Q44: demand curve to shift to the left.
A)
Q44: If an economy is productively inefficient, it
Q51: We can safely say that each point
Q52: The diagram below shows the demand and
Q56: The objective of government regulation and competition
Q58: An economy will be allocatively efficient if
A)
Q59: A major aim of Canadian competition policy
Unlock this Answer For Free Now!
View this answer and more for free by performing one of the following actions

Scan the QR code to install the App and get 2 free unlocks

Unlock quizzes for free by uploading documents