The diagram below shows cost and revenue curves for a natural monopoly producing electricity. Price is dollars per kilowatt hour and quantity is kilowatt hours per day. 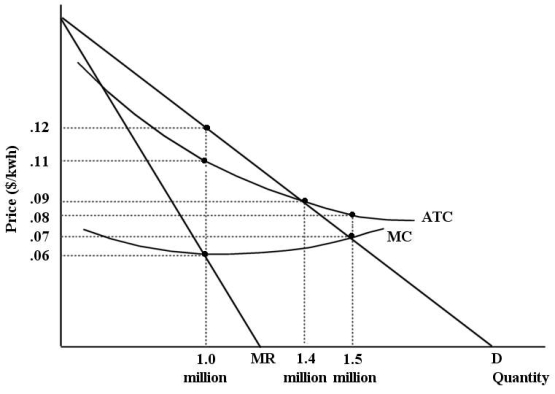 FIGURE 12-7
-Refer to Figure 12-7. If this firm were unregulated and profit maximizing, its profit would beper day.
A) $60 000
B) $120 000
C) $110 000
D) $0
E) $10 000
Correct Answer:
Verified
Q67: Allocative efficiency is a property of the
Q69: Allocative efficiency concerns
A) the allocation of resources
Q72: the marginal cost to the seller of
Q73: The diagram below shows cost and revenue
Q75: The diagram below shows supply, demand, and
Q75: The diagram below shows the demand and
Q78: The diagram below shows supply, demand, and
Q95: The diagram below shows supply, demand, and
Q96: Allocative efficiency is actively sought
A) only by
Q97: Prior to the 1986 amendments to the
Unlock this Answer For Free Now!
View this answer and more for free by performing one of the following actions

Scan the QR code to install the App and get 2 free unlocks

Unlock quizzes for free by uploading documents