The diagram below shows the demand and supply curves in a perfectly competitive market. 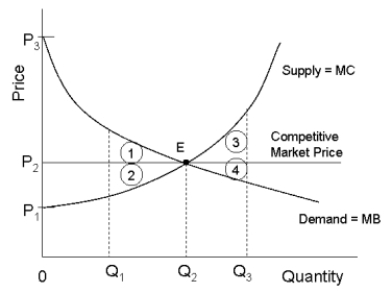 FIGURE 12-5
-Refer to Figure 12-5. If output in this market were Q₃, and the price were still P2, the loss in consumer surplus relative to the competitive equilibrium would be illustrated by area
A) 3 + 4.
B) 1.
C) 3.
D) 4.
E) 2.
Correct Answer:
Verified
Q62: The diagram below shows the market demand
Q71: The diagram below shows cost and revenue
Q72: the marginal cost to the seller of
Q73: The diagram below shows cost and revenue
Q75: The diagram below shows supply, demand, and
Q76: One method of regulating a natural monopoly
Q83: In Canada, the Competition Act specifies that
Q85: According to economist George Stigler, the process
Q95: The diagram below shows supply, demand, and
Q97: Prior to the 1986 amendments to the
Unlock this Answer For Free Now!
View this answer and more for free by performing one of the following actions

Scan the QR code to install the App and get 2 free unlocks

Unlock quizzes for free by uploading documents