The diagram below shows the market demand curve and the cost curves for a single firm. 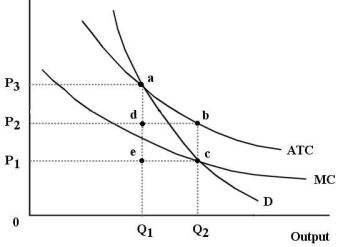 FIGURE 12-6
-Refer to Figure 12-6. Suppose this firm is a government-owned natural monopoly and imposes a price so as to achieve allocative efficiency in this market. The amount of tax revenue that the government must raise elsewhere in the economy to offset the losses of this firm is represented by the area
A) P1P3ae
B) P1P2bc
C) 0P2bQ₂
D) edbc
E) Q₁dbQ₂
Correct Answer:
Verified
Q62: The diagram below shows the market demand
Q76: One method of regulating a natural monopoly
Q81: The diagram below shows the demand and
Q85: According to economist George Stigler, the process
Q93: Consider three firms, A, B and C,
Q102: A natural monopoly
A) generally needs to be
Q103: If all firms are profit maximizers, then
Q104: If a regulatory agency ordered a public
Q107: An economy will be allocatively efficient if
A)
Q109: The diagram below shows the market demand
Unlock this Answer For Free Now!
View this answer and more for free by performing one of the following actions

Scan the QR code to install the App and get 2 free unlocks

Unlock quizzes for free by uploading documents