The diagram below shows the demand and supply curves in a perfectly competitive market. 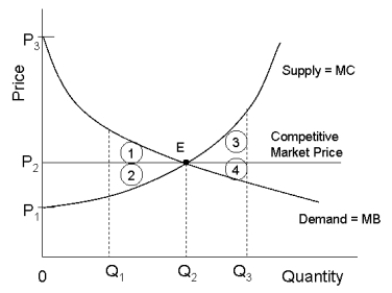 FIGURE 12-5
-Refer to Figure 12-5. If output in this market were Q₁, but the price was still at its free-market level, the loss in consumer surplus relative to the competitive equilibrium would be illustrated by area
A) P3P2E.
B) 1.
C) 2.
D) P1P3E.
E) 1 + 2.
Correct Answer:
Verified
Q62: The diagram below shows the market demand
Q76: One method of regulating a natural monopoly
Q83: In Canada, the Competition Act specifies that
Q83: The diagram below shows the market demand
Q85: According to economist George Stigler, the process
Q93: Consider three firms, A, B and C,
Q95: The diagram below shows supply, demand, and
Q102: A natural monopoly
A) generally needs to be
Q104: If a regulatory agency ordered a public
Q109: The diagram below shows the market demand
Unlock this Answer For Free Now!
View this answer and more for free by performing one of the following actions

Scan the QR code to install the App and get 2 free unlocks

Unlock quizzes for free by uploading documents