Look at the utility function graphed below and select the type of decision maker that corresponds to the graph.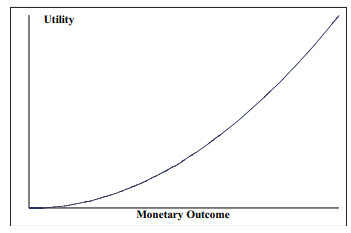
A) Risk averter
B) Risk neutral
C) Risk taker
D) Risk player
Correct Answer:
Verified
Q57: SCENARIO 20-2
The following payoff matrix is given
Q58: SCENARIO 20-2
The following payoff matrix is given
Q59: SCENARIO 20-3
The following information is from 2
Q60: SCENARIO 20-2
The following payoff matrix is given
Q61: To calculate expected profit under certainty,you need
Q62: Look at the utility function graphed below
Q63: The risk seeker's curve represents the utility
Q64: Opportunity loss is the difference between the
Q65: At Eastern University,60% of the students are
Q66: SCENARIO 20-4
A stock portfolio has the following
Unlock this Answer For Free Now!
View this answer and more for free by performing one of the following actions

Scan the QR code to install the App and get 2 free unlocks

Unlock quizzes for free by uploading documents