The figure given below illustrates the market for British pounds. D£ and S£ are the demand and supply curves of the British pounds respectively. 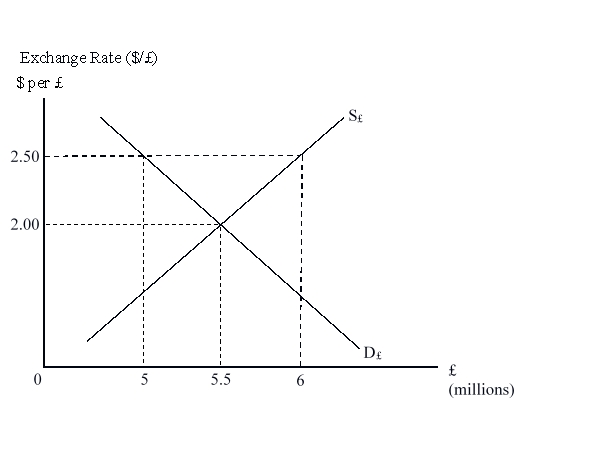 At an exchange rate of $2.50 per pound, there is an:
A) excess demand for 1 million pounds.
B) excess supply of 1 million pounds.
C) excess demand for 0.5 million pounds.
D) excess supply of 0.5 million pounds.
Correct Answer:
Verified
Q28: Other things remaining unchanged, if American exports
Q29: In a _ exchange rate system the
Q30: The figure given below illustrates the market
Q31: Which of the following groups is most
Q32: Under a floating exchange rate system, everything
Q34: Shifts in demand away from French products
Q35: How can one profit through arbitrage if
Q36: The figure given below illustrates the market
Q37: Under the system of pegged exchange rates,
Q38: The figure given below illustrates the market
Unlock this Answer For Free Now!
View this answer and more for free by performing one of the following actions

Scan the QR code to install the App and get 2 free unlocks

Unlock quizzes for free by uploading documents