The figure given below illustrates the market for British pounds. D£ and S£ are the demand and supply curves of the British pounds respectively. 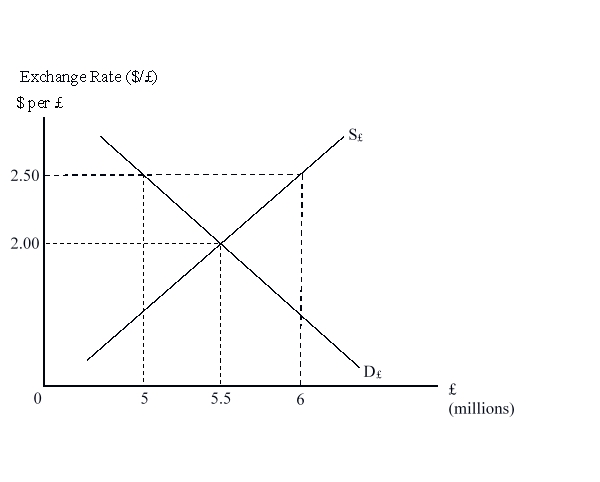 Who among the following groups will most likely benefit if the exchange rate is pegged at $2.50 per pound?
A) The U.S.importers
B) The British importers
C) The British exporters
D) The import-competing producers in the U.K.
Correct Answer:
Verified
Q33: The figure given below illustrates the market
Q34: Shifts in demand away from French products
Q35: How can one profit through arbitrage if
Q36: The figure given below illustrates the market
Q37: Under the system of pegged exchange rates,
Q39: The figure given below illustrates the market
Q40: Under a fixed exchange rate system, a
Q41: Greece was among the 11 EU countries
Q42: The spot exchange rate is the current
Q43: The euro was introduced in the foreign
Unlock this Answer For Free Now!
View this answer and more for free by performing one of the following actions

Scan the QR code to install the App and get 2 free unlocks

Unlock quizzes for free by uploading documents