The figure given below represents the effects in the labor markets due to migration. Here the world has been divided into a high-income "North" (left panel) and a low-income "South" (right panel) . Dn and Sn are the labor demand and the labor supply curves in North. Ds and (Sr + Smig) are the labor demand and pre-migration labor supply curves in South. Sr is the post-migration labor supply curve in South. The value c is the cost of migrating. 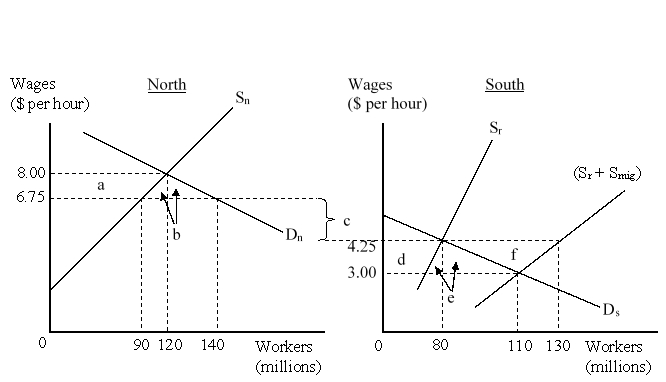 When migration between North and South is allowed, how many workers will choose to migrate to North?
A) 20 million
B) 30 million
C) 40 million
D) 50 million
Correct Answer:
Verified
Q34: Which of the following groups are negatively
Q35: The figure given below represents the effects
Q36: If movement of labor across countries is
Q37: As some government spending is for true
Q38: In the case in which foreign affiliates
Q40: China's economic growth and emergence as a
Q41: Both external and internal factors affect the
Q42: FDI outflows have a positive impact on
Q43: The host country has more reasons to
Q44: Should receiving countries ban all forms of
Unlock this Answer For Free Now!
View this answer and more for free by performing one of the following actions

Scan the QR code to install the App and get 2 free unlocks

Unlock quizzes for free by uploading documents