The figure given below shows a shift in the production-possibility curve of a country from AB to AC. Here, S1 and C1 are the initial production and consumption points respectively. S2 and C2, on the other hand, are the final production and consumption points respectively. Which of the following is illustrated by this figure? 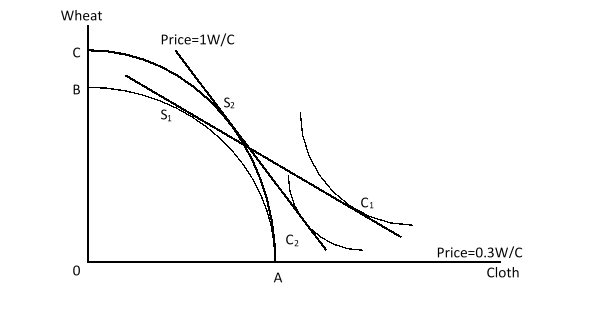
A) A small country experiencing a balanced growth
B) A large country experiencing a balanced growth
C) A small country experiencing growth biased toward cloth production
D) A large country experiencing growth biased toward wheat production.
Correct Answer:
Verified
Q18: In the figure given below, we
Q19: The rapid accumulation of capital and worker
Q20: Suppose country X partially specializes in the
Q21: Suppose country X is one of the
Q22: Suppose a capital-abundant country experiences a significant
Q24: When a small, initially closed country engages
Q25: Suppose a labor-abundant country, exporting a labor-intensive
Q26: The figure given below shows a shift
Q27: The possibility of immiserizing growth can arise
Q28: Which of the following is true of
Unlock this Answer For Free Now!
View this answer and more for free by performing one of the following actions

Scan the QR code to install the App and get 2 free unlocks

Unlock quizzes for free by uploading documents