The figure given below shows a shift in the production-possibility curve of a country from AB to AC. Here, S1 and C1 are the initial production and consumption points respectively. S2 and C2, on the other hand, are the final production and consumption points respectively. Which of the following is illustrated by this figure? 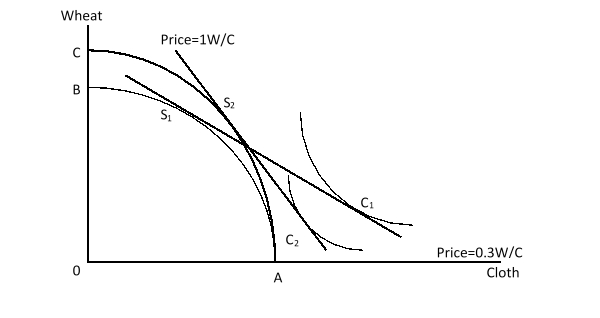
A) The mechanism of reversal in trade pattern
B) The validity of the product cycle hypothesis
C) The immiserizing growth effect in a large country
D) The benefits of trade in a small country
Correct Answer:
Verified
Q21: Suppose country X is one of the
Q22: Suppose a capital-abundant country experiences a significant
Q23: The figure given below shows a shift
Q24: When a small, initially closed country engages
Q25: Suppose a labor-abundant country, exporting a labor-intensive
Q27: The possibility of immiserizing growth can arise
Q28: Which of the following is true of
Q29: The Heckscher-Ohlin theory suggests that research and
Q30: Immiserizing growth is most likely to occur
Q31: Countries that are open to international trade:
A)cannot
Unlock this Answer For Free Now!
View this answer and more for free by performing one of the following actions

Scan the QR code to install the App and get 2 free unlocks

Unlock quizzes for free by uploading documents