In the figure given below AB is the production-possibility curve of Canada. In the absence of trade, the price ratio is 1 bushel of wheat/bale of cotton as shown by the line PQ. The international price ratio is 0.25 bushels of wheat/bale of cotton as shown by the line RS. I1 and I2 are the pre-trade and the post trade community indifference curves of Canada respectively. In the absence of trade Canada will: 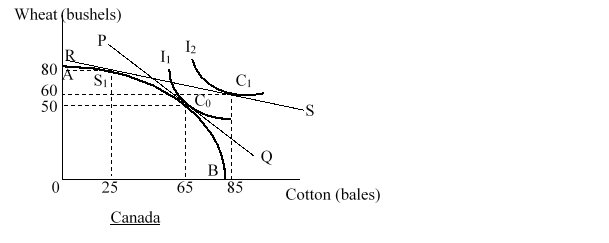
A) produce and consume at point S1.
B) produce and consume at point C0.
C) produce at point S1 and consume at point C0.
D) produce and consume at point C1.
Correct Answer:
Verified
Q1: Assume a two-country two-good two-input model where
Q2: The figure given below shows the post-trade
Q3: In international trade jargon, constant cost production-possibility
Q4: Which of the following economists proposed an
Q5: Assume a two-country two-good two-input model where
Q7: China has 20% of the world's population
Q8: In the figure given below AB is
Q9: The figure given below shows the post-trade
Q10: The figure given below shows the post-trade
Q11: Consider a two-country two-good model where labor
Unlock this Answer For Free Now!
View this answer and more for free by performing one of the following actions

Scan the QR code to install the App and get 2 free unlocks

Unlock quizzes for free by uploading documents