The figure given below shows the post-trade production and consumption points in country Y. AB is the production-possibility curve of country Y. I1 is the community indifference curve of country Y. Country Y imports: 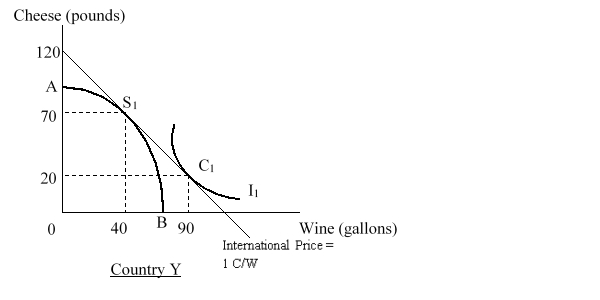
A) 40 gallons of wine.
B) 60 pounds of cheese.
C) 50 gallons of wine.
D) 80 pounds of cheese.
Correct Answer:
Verified
Q5: Assume a two-country two-good two-input model where
Q6: In the figure given below AB is
Q7: China has 20% of the world's population
Q8: In the figure given below AB is
Q9: The figure given below shows the post-trade
Q11: Consider a two-country two-good model where labor
Q12: In the figure given below AB is
Q13: Which of the following statements is true
Q14: The figure given below shows the production-possibility
Q15: Which of the following best explains why
Unlock this Answer For Free Now!
View this answer and more for free by performing one of the following actions

Scan the QR code to install the App and get 2 free unlocks

Unlock quizzes for free by uploading documents