In the figure given below AB is the production-possibility curve of Canada. In the absence of trade, the price ratio is 1 bushel of wheat/bale of cotton as shown by the line PQ. The international price ratio is 0.25 bushels of wheat/bale of cotton as shown by the line RS. I1 and I2 are the pre-trade and the post trade community indifference curves of Canada respectively. Which of the following can be inferred from this figure? 
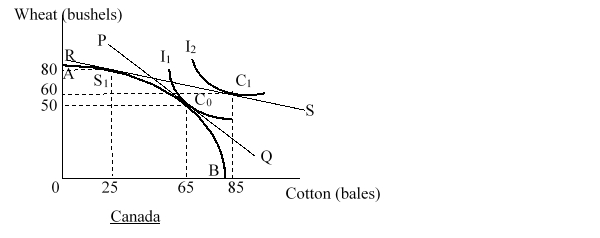
A) Canada has a comparative advantage in the production of wheat.
B) Canada has a comparative advantage in the production of cotton.
C) Canada has an absolute disadvantage in the production of both the goods.
D) Canada has absolute advantage in the production of both the goods.
Correct Answer:
Verified
Q7: China has 20% of the world's population
Q8: In the figure given below AB is
Q9: The figure given below shows the post-trade
Q10: The figure given below shows the post-trade
Q11: Consider a two-country two-good model where labor
Q13: Which of the following statements is true
Q14: The figure given below shows the production-possibility
Q15: Which of the following best explains why
Q16: Assume that country X produces two goods-sugar
Q17: The figure given below shows the production-possibility
Unlock this Answer For Free Now!
View this answer and more for free by performing one of the following actions

Scan the QR code to install the App and get 2 free unlocks

Unlock quizzes for free by uploading documents