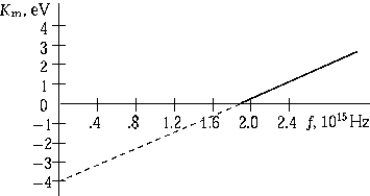
 The graph shows the maximum kinetic energy of electrons emitted by a photosensitive surface as a function of the frequency of the incident radiation. The slope of this curve represents
A) the intensity of the incident radiation.
B) the maximum kinetic energy.
C) the threshold frequency.
D) Planck's constant.
E) the stopping potential.
Correct Answer:
Verified
Q24: Q24: Light falling on the surface of a Q25: Q26: The dissociation energy is the energy required Q27: Magnetic resonance imaging MRI) is a much-used Q28: The energy of a quantum of radiation Q30: The photoelectric threshold of a certain metal Q33: A Compton-scattered x-ray photon has less energy Q34: The work function for a metal is Q44: When a surface is illuminated with light![]()
![]()
Unlock this Answer For Free Now!
View this answer and more for free by performing one of the following actions

Scan the QR code to install the App and get 2 free unlocks

Unlock quizzes for free by uploading documents