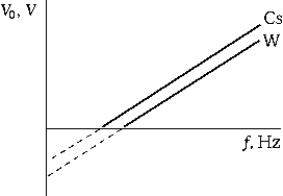
 The graph shows the stopping potential for photoelectrons as a function of the frequency of the incident light for two different metals Cs and W) . Which of the following statements is true?
A) Because the intercepts are different, Planck's constant is not constant.
B) For a given frequency of incident light, the photoelectrons from W are more energetic than those from Cs.
C) The maximum kinetic energy of the photoelectrons increases as the frequency of the incident light increases.
D) The stopping potentials for all metals are the same.
E) The threshold frequency for Cs is greater than that for W.
Correct Answer:
Verified
Q6: Which of the following experiment(s)illustrates the particle
Q20: The work function for tungsten is 4.58
Q21: The energy of an x-ray photon of
Q22: Microwaves range in wavelength from about 2.0
Q25: Q26: The maximum kinetic energy of photoelectrons produced Q26: The dissociation energy is the energy required Q27: Magnetic resonance imaging MRI) is a much-used Q28: The energy of a quantum of radiation Q29: ![]()
![]()
Unlock this Answer For Free Now!
View this answer and more for free by performing one of the following actions

Scan the QR code to install the App and get 2 free unlocks

Unlock quizzes for free by uploading documents