The graph shows how the position of a particle depends on time. 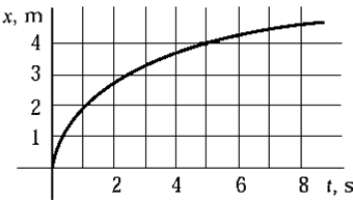 Which choice is closest to the average speed of the particle in the time interval between 0 and 6 s?
A) 0.40 m/s
B) 0.67 m/s
C) 0.75 m/s
D) 1.50 m/s
E) 2.22 m/s
Correct Answer:
Verified
Q10: The displacement of an object for a
Q11: You drive for 30 min for 30
Q12: You drive for 30 min at 100
Q14: Which of the following is NOT an
Q15: You drive for 30 min for 30
Q17: In which graph of v versus t
Q18: The graph represents the position of a
Q19: Which graph of v versus t best
Q20: Four successive displacements of 3 km, 4
Q21: An object moves along the x axis
Unlock this Answer For Free Now!
View this answer and more for free by performing one of the following actions

Scan the QR code to install the App and get 2 free unlocks

Unlock quizzes for free by uploading documents