The graph represents the position of a particle along the x axis as a function of time. 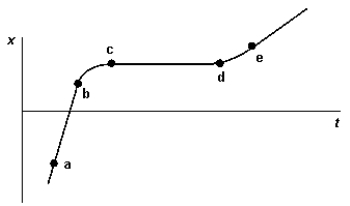 The interval in which the velocity of this particle is negative is
A) a-b
B) b-c
C) d-e
D) c-d
E) None of these are correct.
Correct Answer:
Verified
Q10: The displacement of an object for a
Q14: Which of the following is NOT an
Q15: You drive for 30 min for 30
Q16: The graph shows how the position of
Q17: In which graph of v versus t
Q19: Which graph of v versus t best
Q20: Four successive displacements of 3 km, 4
Q21: An object moves along the x axis
Q22: The graph is a plot of velocity
Q23: An object moves along the x-axis as
Unlock this Answer For Free Now!
View this answer and more for free by performing one of the following actions

Scan the QR code to install the App and get 2 free unlocks

Unlock quizzes for free by uploading documents