Essay
Use the following graph shown to fill in the table that follows. 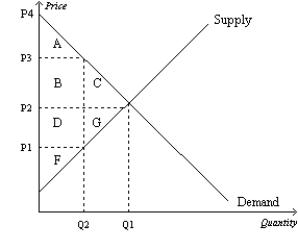
Correct Answer:
Verified
Related Questions
Q33: Figure 8-26 Q57: Figure 8-29 Q101: Using demand and supply diagrams, show the Q103: Suppose the demand curve and the supply Q105: Is the United States' labor supply more Q107: Describe the Laffer curve. Q108: Suppose the demand curve and the supply Q113: Suppose that instead of a supply-demand diagram, Q114: Illustrate on three demand-and-supply graphs how the Q118: John has been in the habit of![]()
![]()
Unlock this Answer For Free Now!
View this answer and more for free by performing one of the following actions

Scan the QR code to install the App and get 2 free unlocks

Unlock quizzes for free by uploading documents