Figure 6-29
Suppose the government imposes a $2 on this market. 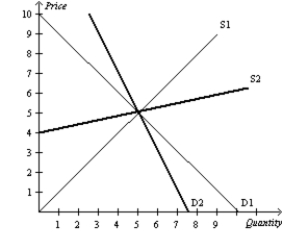
-Refer to Figure 6-29.Suppose D1 represents the demand curve for gasoline in both the short run and long run,S1 represents the supply curve for gasoline in the short run,and S2 represents the supply curve for gasoline in the long run.After the imposition of the $2,the price paid by buyers will be
A) higher in the long run than in the short run.
B) higher in the short run than in the long run.
C) equivalent in the short run and the long run.
D) unable to be determined without additional information.
Correct Answer:
Verified
Q180: Suppose that the demand for light bulbs
Q181: The demand for salt is inelastic,and the
Q182: Figure 6-33
The diagram shows the effect of
Q183: Figure 6-29
Suppose the government imposes a $2
Q184: Assume the demand for cigarettes is relatively
Q186: Figure 6-29
Suppose the government imposes a $2
Unlock this Answer For Free Now!
View this answer and more for free by performing one of the following actions

Scan the QR code to install the App and get 2 free unlocks

Unlock quizzes for free by uploading documents