Multiple Choice
Figure 20-1
Number of Poor 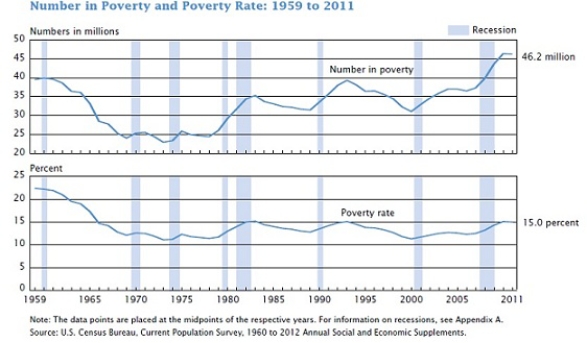
-Refer to Figure 20-1. Between 1959 and 2011 the poverty rate has
A) increased overall.
B) decreased overall.
C) stayed the same overall.
D) moved in the opposite direction of the number of people in poverty.
Correct Answer:
Verified
Related Questions
Q291: Figure 20-3 Q292: The distribution of income for Abbyville is Q293: Figure 20-1 Q294: The distribution of income for Inequalia is![]()
Number of Poor ![]()

