Multiple Choice
Figure 20-1
Number of Poor 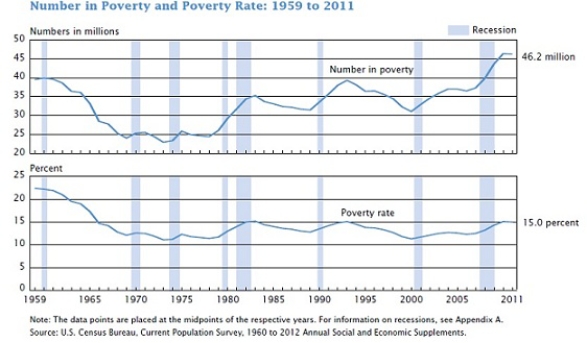
-Refer to Figure 20-1. Between 1965 and 2011, during recessions (the shaded bars) the number of individuals in poverty has
A) increased.
B) decreased.
C) not changed.
D) decreased and then increased.
Correct Answer:
Verified
Related Questions

