Figure 20-3 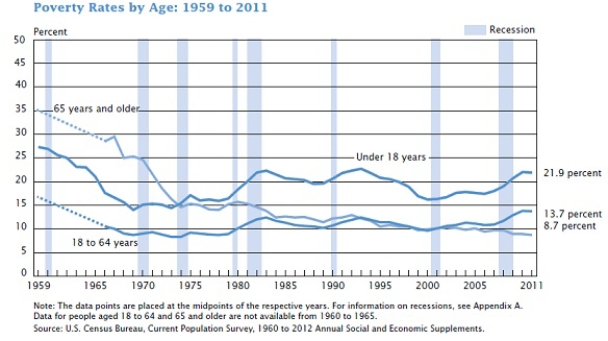
-Refer to Figure 20-3. Which of the following is consistent with the data reported in the figure?
A) Policies to reduce elderly (65 years and older) poverty rates since 1959 seem to have been effective.
B) The age group suffering the highest poverty rate in recent years has been 18 to 64 year olds.
C) Policies to reduce youth (under 18 years) poverty rates since 1959 seem to have been effective.
D) All of the above are correct.
Correct Answer:
Verified
Q284: Figure 20-3 Q285: The poverty line in the country of Q286: Figure 20-3 Q287: Figure 20-3 Q288: The distribution of income for Dismal is Q290: The poverty line in the country of Q291: Figure 20-3 Q292: The distribution of income for Abbyville is Q293: Figure 20-1 Q294: The distribution of income for Inequalia is Unlock this Answer For Free Now! View this answer and more for free by performing one of the following actions Scan the QR code to install the App and get 2 free unlocks Unlock quizzes for free by uploading documents![]()
![]()
![]()
![]()
Number of Poor ![]()

