Table 12-9
United States Income Tax Rates for a Single Individual, 2012 and 2013. 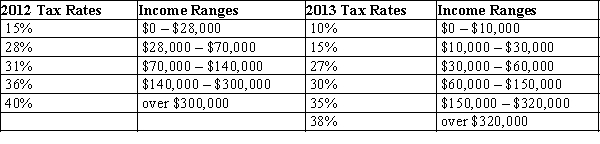
-Refer to Table 12-9. Bill is a single person whose taxable income is $35,000 a year. What happened to his average tax rate between 2012 and 2013?
A) It increased.
B) It decreased.
C) It did not change.
D) We do not have enough information to answer this question.
Correct Answer:
Verified
Q446: Table 12-7
The following table shows the marginal
Q447: Table 12-9
United States Income Tax Rates for
Q448: Table 12-10 Q449: Table 12-9 Q450: Table 12-9 Q452: Table 12-9 Q453: Table 12-9 Q454: Table 12-9 Q455: Table 12-9 Q456: Table 12-8![]()
United States Income Tax Rates for
United States Income Tax Rates for
United States Income Tax Rates for
United States Income Tax Rates for
United States Income Tax Rates for
United States Income Tax Rates for
The following table presents the total
Unlock this Answer For Free Now!
View this answer and more for free by performing one of the following actions

Scan the QR code to install the App and get 2 free unlocks

Unlock quizzes for free by uploading documents