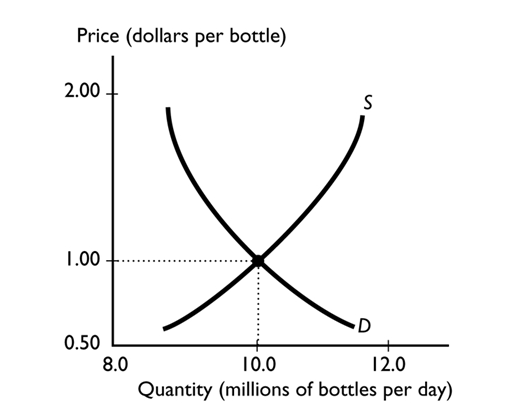
The graph illustrates the market for bottled water. When the price exceeds the equilibrium price, the quantity demanded is-------------------- the quantitysupplied and the price of the good will -------------------- .
A) greater than; fall
B) equal to; fall
C) greater than; rise
D) less than; rise
E) less then; fall
Correct Answer:
Verified
Q92: When demand increases,
A)consumers buy more of the
Q93: In Great Britain, raising taxes on gasoline
Q94: Car insurance and cars are complements. If
Q96: Consider the market for peanut butter. If
Q98: Consider the market for peanut butter. If
Q99: Consider the market for bread. If the
Q100: Because of the high cost of fuel,
Q101: Market demand curves are obtained by
A)summing the
Q102: Q233: ![]()
![]()
Unlock this Answer For Free Now!
View this answer and more for free by performing one of the following actions

Scan the QR code to install the App and get 2 free unlocks

Unlock quizzes for free by uploading documents