-
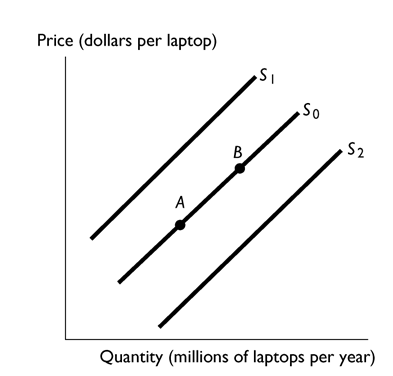
The above figure shows the market for laptops. Which of the following shifts the supply curve from S0 to S2?
A) a decrease in the number of laptop manufactures and sellers
B) a decrease in the price of laptops
C) an increase in the productivity of the workers manufacturing laptops
D) an increase in the cost of hard drives
E) an increase in the price of laptops
Correct Answer:
Verified
Q97: Q98: Consider the market for peanut butter. If Q99: Consider the market for bread. If the Q100: Because of the high cost of fuel, Q101: Market demand curves are obtained by Q103: If good weather conditions result in a Q104: A surplus of cardboard boxes means that Q105: The phrase "a change in demand" most Q221: Q282: Unlock this Answer For Free Now! View this answer and more for free by performing one of the following actions Scan the QR code to install the App and get 2 free unlocks Unlock quizzes for free by uploading documents![]()
A)summing the
A)at![]()
![]()

