Figure 9-26
The diagram below illustrates the market for baseballs in the U.S. 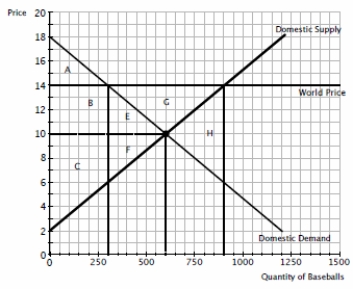
-Refer to figure 9-26. After the opening of the baseball market to international trade, producer surplus in the U.S.
A) increases by the area G.
B) decreases by the area E + F.
C) decreases by the area B + E.
D) increases by the area B + E + G
Correct Answer:
Verified
Q8: Patterns of trade among nations are primarily
Q133: The nation of Wheatland forbids international trade.
Q283: Suppose that the U.S.has a comparative advantage
Q284: Figure 9-25
The following diagram shows the domestic
Q288: Figure 9-26
The diagram below illustrates the market
Q289: Figure 9-25
The following diagram shows the domestic
Q291: Figure 9-26
The diagram below illustrates the market
Q300: Figure 9-26
The diagram below illustrates the market
Q301: Figure 9-26
The diagram below illustrates the market
Q418: Figure 9-26
The diagram below illustrates the market
Unlock this Answer For Free Now!
View this answer and more for free by performing one of the following actions

Scan the QR code to install the App and get 2 free unlocks

Unlock quizzes for free by uploading documents