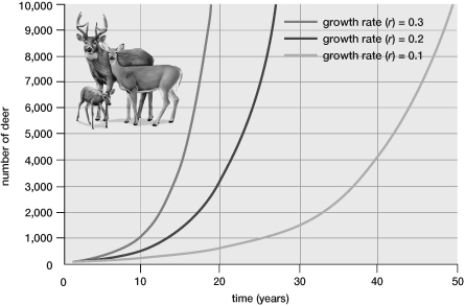
-Which population represented on the graph has the highest biotic potential?
A) The population represented by the middle curve has the highest biotic potential.
B) The population represented by the curve on the left has the highest biotic potential.
C) The population represented by the curve on the right has the highest biotic potential.
D) All three populations have the same biotic potential.
Correct Answer:
Verified
Q103: A laboratory experiment followed the growth of
Q104: At the start of a study, 200
Q106: The population shown in the graph is
Q107: An ecologist is studying the painted turtle
Q109: Many species of field mice are able
Q110: A small country begins to experience stable
Q111: An ecologist is studying the painted turtle
Q112: Based on its population pyramid, this population
Q113: During the winter of 1999, minimum temperatures
Q114: What factors determine Earthʹs carrying capacity for
Unlock this Answer For Free Now!
View this answer and more for free by performing one of the following actions

Scan the QR code to install the App and get 2 free unlocks

Unlock quizzes for free by uploading documents