Multiple Choice
The population shown in the graph is demonstrating 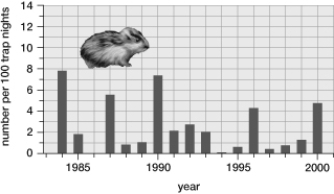
A) logistic population growth.
B) a typical boom- and- bust pattern.
C) clumped distribution.
D) an S- curve growth pattern.
E) exponential growth.
Correct Answer:
Verified
Related Questions
Q102: The population shown in the pyramid is
Q103: A laboratory experiment followed the growth of
Q104: At the start of a study, 200
Q107: An ecologist is studying the painted turtle
Unlock this Answer For Free Now!
View this answer and more for free by performing one of the following actions

Scan the QR code to install the App and get 2 free unlocks

Unlock quizzes for free by uploading documents