Suppose that call-center receives on average 1.7 calls per minute. The graphs below show the probability of receiving calls. Determine the distribution curve with the shaded region that corresponds to the probability of the event that call happens between two and six minutes. Chose the correct graph.
A) 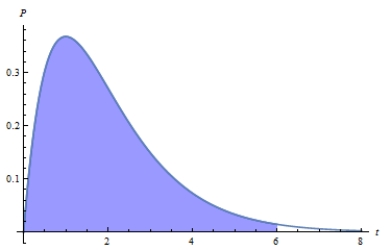
B) 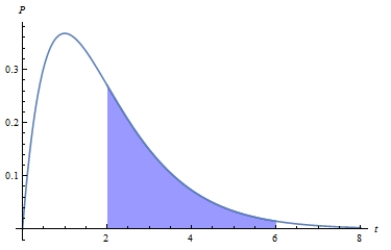
C) 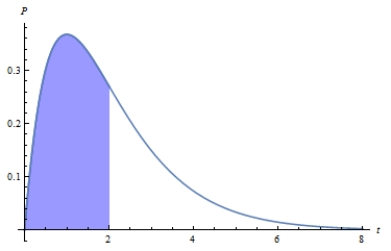
D) 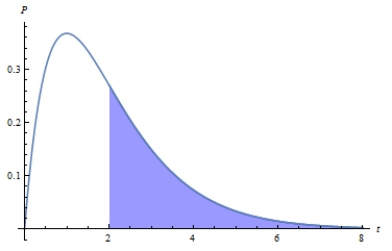
E) 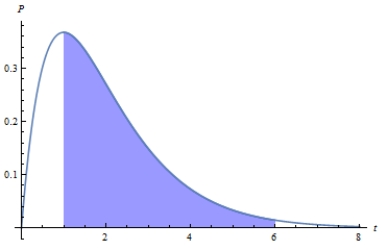
Correct Answer:
Verified
Q21: Briefly describe how the correlation coefficient can
Q25: Briefly describe how one would decide which
Q36: The time that it takes a randomly
Q45: In a study of the reaction times
Q63: Seventy-five percent of the computers sold by
Q64: Suppose that in a certain metropolitan area
Q65: Suppose that the random variable 
Q66: Ron rolls a six-sided dice until the
Q67: The graphs below are normal probability plots
Q70: Suppose that 73% of the visitors to
Unlock this Answer For Free Now!
View this answer and more for free by performing one of the following actions

Scan the QR code to install the App and get 2 free unlocks

Unlock quizzes for free by uploading documents