Exhibit 4-7
Golden-rumped elephant shrews have long flexible snouts, used to overturn leaf-litter where they find their food: millipedes, insects and spiders. These animals are among the approximately 10% of mammalian species that mate for life. Just why these mammals are monogamous is poorly understood, and one theory is that a monogamous male would have to defend less territory from intrusion by other males. The home range of an animal, i.e. that area over which they typically travel, is a function of diet and energy consumption of the animal. The energy consumption is, in turn, typically a function of the animal's size. In a recent study, investigators reasoned that if monogamy was related in some way to the home territory, this should be detectable by comparing these animals to other insect-eating mammals. Data were gathered on 27 similar species and are presented in the table below. 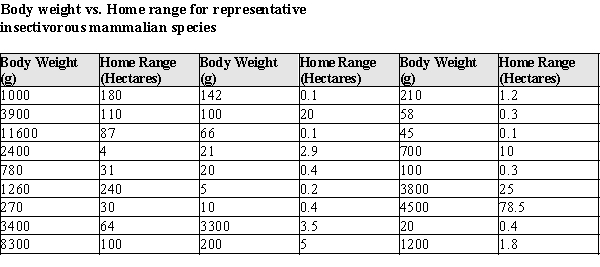 After fitting a straight line model,
  , significant curvature was detected in the residual plot, and two transformed models were chosen for further analysis: the power and exponential models. The computer output for these transformed models and the residual plots follow.
Residual Plot and Statistical Analysis - exponential model 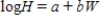
 Log Home Range vs. Weight
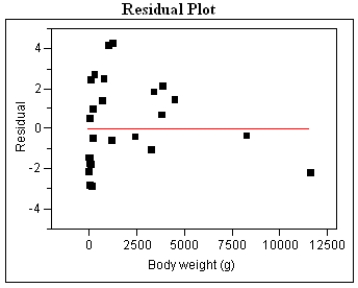
Log(H) = 0.250 + 0.000231 W  Residual Plot and Statistical Analysis - Power model
 Log Home Range vs. Log Weight
Log(H) = −1.601 + 0.893Log(W) 
-Refer to Exhibit 4-7.
Generally speaking, which of the two models, power or exponential, is better at predicting the log (Home Range)? Provide statistical justification for your choice.
Correct Answer:
Verified
View Answer
Unlock this answer now
Get Access to more Verified Answers free of charge
Q55: Exhibit 4-7
Golden-rumped elephant shrews have long flexible
Q56: Exhibit 4-5
During the first 3 centuries AD,
Q57: Exhibit 4-4:
Biological theory suggests that the relationship
Q58: To confirm Ohm's law, the student measures
Q59: As early as 3 years of age,
Q61: For the given scatterplot, identify if there
Q62: Identify linear patterns in the scatterplots shown.
A)
Q63: According to the information of the Council
Q64: For the given scatterplot, identify if there
Q65: The plot given below shows the points
Unlock this Answer For Free Now!
View this answer and more for free by performing one of the following actions

Scan the QR code to install the App and get 2 free unlocks

Unlock quizzes for free by uploading documents