The plot given below shows the points and the regression lines for the data set on the same graph. The blue line is the regression line for all points. The red line is the regression line for the data points excluding those which influence observation. 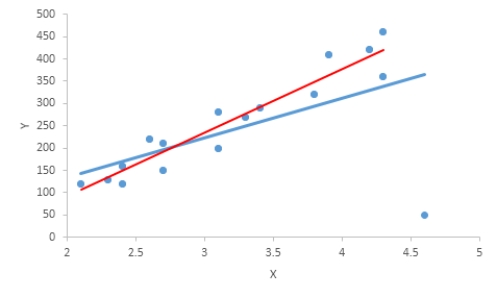 Describe the effect of the influential observation on the equation of the least squares regression line. Select the correct statement.
A) The influential observation changes the equation of the regression line.
B) The influential observation is located long far from the other data points.
C) The influential observation only increases the error of estimation.
D) The influential observation is always an outlier.
Correct Answer:
Verified
Q60: Exhibit 4-7
Golden-rumped elephant shrews have long flexible
Q61: For the given scatterplot, identify if there
Q62: Identify linear patterns in the scatterplots shown.
A)
Q63: According to the information of the Council
Q64: For the given scatterplot, identify if there
Q66: In the season 2016-2017 Chelsea won English
Q67: We know that the linear regression must
Q68: According to the Hooke's Law the force
Q69: One should get nice enough grades in
Q70: According to official data of "http://www.census.org/" population
Unlock this Answer For Free Now!
View this answer and more for free by performing one of the following actions

Scan the QR code to install the App and get 2 free unlocks

Unlock quizzes for free by uploading documents