In a story written in December 2002, the Des Moines Register reported on the percentages of students who qualify for Free/Reduced lunch programs in the elementary schools in Des Moines, Iowa. The data, by elementary school, appears in the table below. 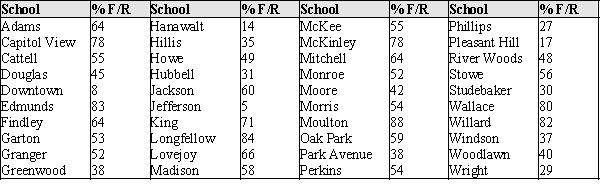 The data presented in the table about the Des Moines, Iowa, elementary schools was from an article that related the percent of children eligible for Free and Reduced lunch and teacher experience. The percent of children eligible for Free/Reduced lunch is generally regarded as an indicator of the socio-economic status of a neighborhood. The concern of the Des Moines Register in the article was that the least experienced teachers typically teach students from low-income families. The accompanying scatter plot shows the data from the article.
 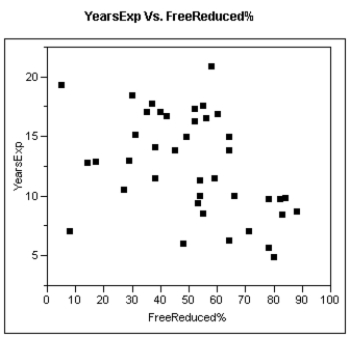 (a)If the Des Moines Register is correct, what sort of pattern should "ideally" appear in the scatter plot?
(b)Does this pattern emerge in these data? (Hint: Consider separately those schools with less than 75% eligibility, and those with greater than 75% eligibility for Free/Reduced lunch.)
Correct Answer:
Verified
View Answer
Unlock this answer now
Get Access to more Verified Answers free of charge
Q42: Artificial bird nests have been used extensively
Q43: Investigators studying the relation between gender and
Q44: As part of the United States Census,
Q45: Exhibit 2-3
There has been a recent increase
Q46: Exhibit 2-3
There has been a recent increase
Q48: The pie chart below summarizes the results
Q49: Exhibit 2-4
In the article, "Scaling of Mammalian
Q50: In birds, the muscles that pull the
Q51: In the article, "Dimensional Relationships for Flying
Q52: One of the "media messages" sent by
Unlock this Answer For Free Now!
View this answer and more for free by performing one of the following actions

Scan the QR code to install the App and get 2 free unlocks

Unlock quizzes for free by uploading documents