Investigators studying the relation between gender and the interests of early adolescents asked boys and girls in grades 5-9 to indicate on a 7-point scale their degree of interest in topics such as Life, Sports, and Cars.
The data in the scatter plot represent average levels of interest for boys and girls in grades 5 - 9. Each point represents one topic listed by the investigators. For example, boys average rating for "Opposite sex" as a 6.2, while girls on average rated their interest in this topic as 6.0 on the 7 point interest scale. This is recorded as the point (6.2, 6.0). 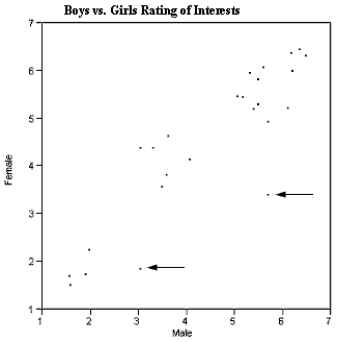 There are three interesting features of this scatter plot that you are to interpret below. What can you infer from each of these features of the scatterplot?
(a)The points generally seem to scatter around the line, y = x.
(b)There seem to be three clusters of points, one in the lower left, one in the middle, and one in the upper right of the graph.
(c)There are two points (as indicated by the arrows) that do not seem to fit the overall pattern. What can be said about the topics these points represent?
Correct Answer:
Verified
View Answer
Unlock this answer now
Get Access to more Verified Answers free of charge
Q38: According to the stem-and-leaf display below, how
Q39: An experiment was performed to determine which
Q40: Bird-plane collisions
Collisions between birds and airplanes are
Q41: In a survey of 30 working adults
Q42: Artificial bird nests have been used extensively
Q44: As part of the United States Census,
Q45: Exhibit 2-3
There has been a recent increase
Q46: Exhibit 2-3
There has been a recent increase
Q47: In a story written in December 2002,
Q48: The pie chart below summarizes the results
Unlock this Answer For Free Now!
View this answer and more for free by performing one of the following actions

Scan the QR code to install the App and get 2 free unlocks

Unlock quizzes for free by uploading documents