In the figure, which curve represents the normal hemoglobin oxygen dissociation curve?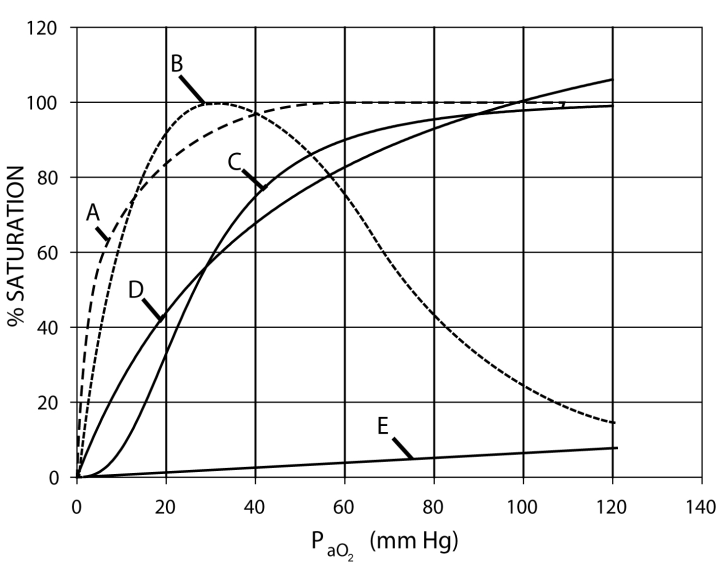
A) A
B) B
C) C
D) D
E) E
Correct Answer:
Verified
Q2: Shifting the hemoglobin oxygen dissociation curve to
Q3: Oxygen consum ption occurs
A) At the cell
Q4: Positive cooperativity mak es the oxygen disso
Q5: The normal saturation of hemoglobin in arterial
Q6: Oxygen binding to hemoglobin
A) occurs with a
Q8: Am ong the following, the highest PCO2
Q9: Chloride
A) Moves into RBCs in the
Q10: Among the following, the highest PO2 is
Q11: Increasing the CO2 in the tissues causes
A)
Q12: Which of the following DOES NOT shift
Unlock this Answer For Free Now!
View this answer and more for free by performing one of the following actions

Scan the QR code to install the App and get 2 free unlocks

Unlock quizzes for free by uploading documents