The graphic shown below is a block diagram for an automated test system. Block 3 represents the 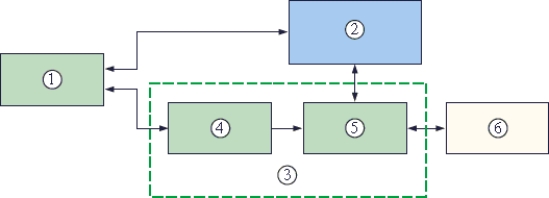
A) switching circuitry.
B) test fixture.
C) unit under test.
D) test controller.
Correct Answer:
Verified
Q4: This is a flow chart for an)_
Q5: Presenting a large program as a small
Q6: The graphic shown below is a block
Q7: Test fixture switching circuits use _ to
Q8: The flowchart symbol for an output is
Q9: The test fixture shown below would be
Q10: Which of the following is not a
Q11: This is a flow chart for an)_
Q12: This is a flow chart for an)_
Q13: This is a flow chart for an)_
Unlock this Answer For Free Now!
View this answer and more for free by performing one of the following actions

Scan the QR code to install the App and get 2 free unlocks

Unlock quizzes for free by uploading documents