Multiple Choice
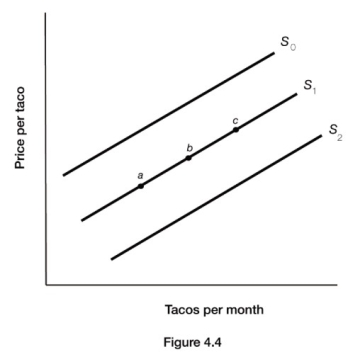
-Figure 4.4 illustrates the supply of tacos. An increase in the supply of tacos is represented by a movement from
A) point a to point b.
B) point c to point b.
C) S2 to S1.
D) S0to S1.
Correct Answer:
Verified
Related Questions
Q112: Olives are used to produce olive oil.
Q114: Q115: A decrease in demand will cause the Q116: Describe the changes in the variables that Q118: The price of iPhones has fallen dramatically. Q119: Explain the difference between a change in![]()
Unlock this Answer For Free Now!
View this answer and more for free by performing one of the following actions

Scan the QR code to install the App and get 2 free unlocks

Unlock quizzes for free by uploading documents