Multiple Choice
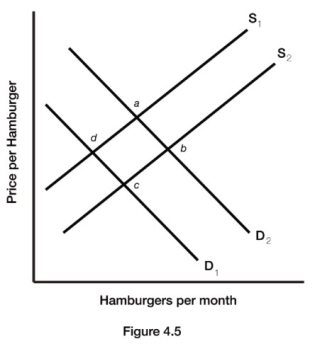
-Figure 4.5 illustrates a set of supply and demand curves for hamburgers. A decrease in supply and a decrease in demand are represented by a movement from
A) point c to point a.
B) point b to point d.
C) point d to point a.
D) point a to point b.
Correct Answer:
Verified
Related Questions
Q116: Describe the changes in the variables that
Q117: Q118: The price of iPhones has fallen dramatically. Q119: Explain the difference between a change in Q122: If producers have an expectation of higher Unlock this Answer For Free Now! View this answer and more for free by performing one of the following actions Scan the QR code to install the App and get 2 free unlocks Unlock quizzes for free by uploading documents![]()

