After the financial crisis of 2007/2008, the Dow Jones Industrial Average (DJIA) improved from a low of 7278 on March 20, 2009, to new records just a few years later.On August 8, 2011, the Dow dropped 634.8 points.A histogram of day-to-day changes in the DJIA looked like the histogram below.An accurate description of the distribution of changes in the DJIA is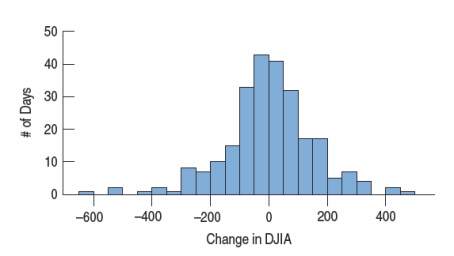
A) The distribution is fairly symmetric.
B) The distribution is somewhat left skewed with a number of low outliers.
C) A normal probability plot would add information about the normality of the data set.
D) Both A and C
E) Both B and C
Correct Answer:
Verified
Q145: A government agency has 6000 employees.As an
Q146: As a result of the financial crisis
Q147: College students were given three choices of
Q148: A Normal probability plot of the weights
Q149: IT staff for a large corporation has
Q151: Chris Columbus is responsible for controlling inventory
Q152: Assume that a set of test scores
Q153: A manufacturer of cordless electric shavers sampled
Q154: The residual, or the difference, between the
Q155: In one city, 47.5% of adults are
Unlock this Answer For Free Now!
View this answer and more for free by performing one of the following actions

Scan the QR code to install the App and get 2 free unlocks

Unlock quizzes for free by uploading documents