Figure 26-2 The Figure Depicts a Supply-Of-Loanable-Funds Curve and Two Demand-For-Loanable-Funds Curves
Figure 26-2
The figure depicts a supply-of-loanable-funds curve and two demand-for-loanable-funds curves. 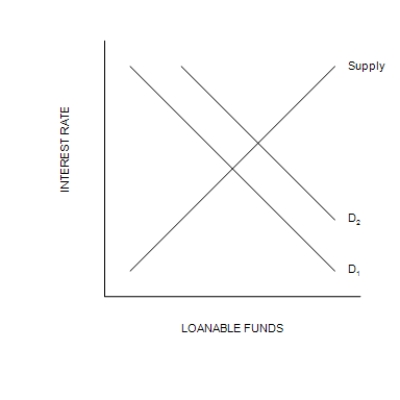
-Refer to Figure 26-2. What is measured along the horizontal axis of the graph?
A) The quantity of loanable funds
B) The size of the government budget deficit or surplus
C) The interest rate
D) Private saving
Correct Answer:
Verified
Q211: Figure 26-2
The figure depicts a supply-of-loanable-funds curve
Q212: Figure 26-1
The figure depicts a demand-for-loanable-funds curve
Q213: If the government instituted an investment tax
Q214: Which of the following counts as part
Q215: In 2002 mortgage rates fell and mortgage
Q217: If the nominal interest rate is 8
Q218: If the demand for loanable funds shifts
Q219: Figure 26-3
The figure shows two demand-for-loanable-funds curves
Q220: A larger budget deficit
A)raises the interest rate
Q221: Figure 26-3
The figure shows two demand-for-loanable-funds curves
Unlock this Answer For Free Now!
View this answer and more for free by performing one of the following actions

Scan the QR code to install the App and get 2 free unlocks

Unlock quizzes for free by uploading documents