Figure 26-2 The Figure Depicts a Supply-Of-Loanable-Funds Curve and Two Demand-For-Loanable-Funds Curves
Figure 26-2
The figure depicts a supply-of-loanable-funds curve and two demand-for-loanable-funds curves. 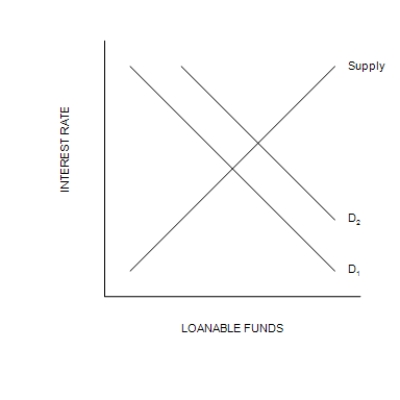
-Refer to Figure 26-2. Which of the following events would shift the demand curve from D1 to D2?
A) The government goes from running a budget deficit to running a budget surplus.
B) Firms become optimistic about the future and, as a result, they plan to increase their purchases of new equipment and construction of new factories.
C) A change in the tax laws encourages people to consume less and save more.
D) A change in the tax laws encourages people to consume more and save less.
Correct Answer:
Verified
Q206: What would happen, all else equal, in
Q207: Suppose the government changed the tax laws,
Q208: If we were to change the interpretation
Q209: Crowding out occurs when investment declines because
Q210: Which of the following would necessarily create
Q212: Figure 26-1
The figure depicts a demand-for-loanable-funds curve
Q213: If the government instituted an investment tax
Q214: Which of the following counts as part
Q215: In 2002 mortgage rates fell and mortgage
Q216: Figure 26-2
The figure depicts a supply-of-loanable-funds curve
Unlock this Answer For Free Now!
View this answer and more for free by performing one of the following actions

Scan the QR code to install the App and get 2 free unlocks

Unlock quizzes for free by uploading documents