Figure 13-6
The following figure depicts average total cost functions for a firm that produces automobiles. 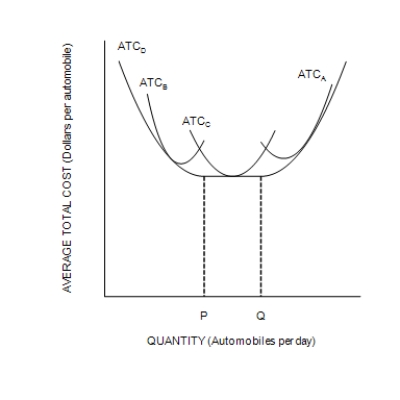
-Refer to Figure 13-6. The firm experiences economies of scale at which output levels?
A) Output levels less than P
B) Output levels between P and Q
C) Output levels greater than Q
D) Output level greater than P
Correct Answer:
Verified
Q250: Table 13-11 Q251: In the long run a company that Q252: Suppose that a firm's long-run average total Q253: Q254: A firm that wants to achieve economies Q256: The most likely explanation for economies of Q257: If a firm experiences constant returns to Q258: Figure 13-6 Q259: Firms may experience diseconomies of scale when Q260: Figure 13-6
![]()
![]()
The following figure depicts average total
A)they
The following figure depicts average total
Unlock this Answer For Free Now!
View this answer and more for free by performing one of the following actions

Scan the QR code to install the App and get 2 free unlocks

Unlock quizzes for free by uploading documents