Figure 13-6
The following figure depicts average total cost functions for a firm that produces automobiles. 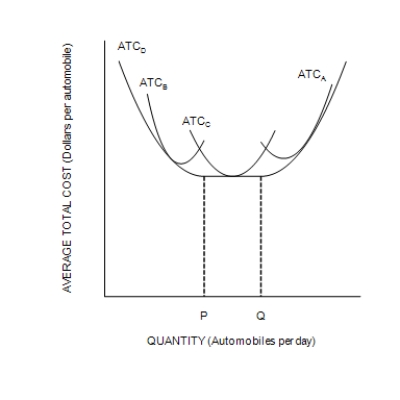
-Refer to Figure 13-6. At levels of output between P and Q, the firm experiences
A) economies of scale.
B) diseconomies of scale.
C) constant returns to scale.
D) both the benefits of specialization and diminishing marginal productivity.
Correct Answer:
Verified
Q251: In the long run a company that
Q252: Suppose that a firm's long-run average total
Q253: Q254: A firm that wants to achieve economies Q255: Figure 13-6 Q256: The most likely explanation for economies of Q257: If a firm experiences constant returns to Q259: Firms may experience diseconomies of scale when Q260: Figure 13-6 Q261: ![]()
The following figure depicts average total
A)they
The following figure depicts average total![]()
Unlock this Answer For Free Now!
View this answer and more for free by performing one of the following actions

Scan the QR code to install the App and get 2 free unlocks

Unlock quizzes for free by uploading documents