Multiple Choice
Figure 3-1
Graph (a)
Graph (b)
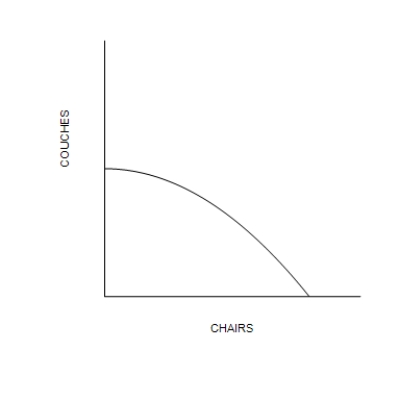
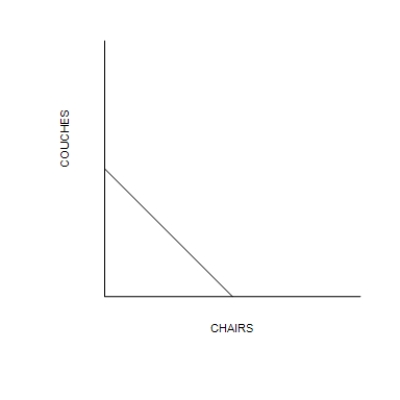
-Refer to Figure 3-1. The rate of trade-off between producing chairs and producing couches is constant in
A) Graph (a) only.
B) Graph (b) only.
C) both Graph (a) and graph (b) .
D) neither Graph (a) nor Graph (b) .
Correct Answer:
Verified
Related Questions

