Figure 3-1
Graph (a)
Graph (b)
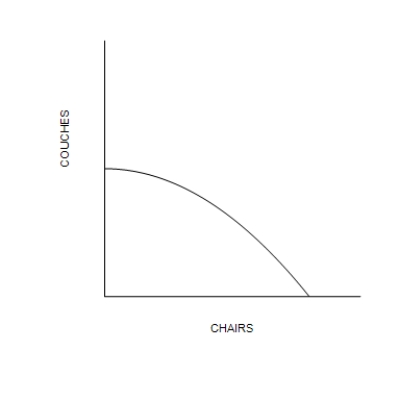
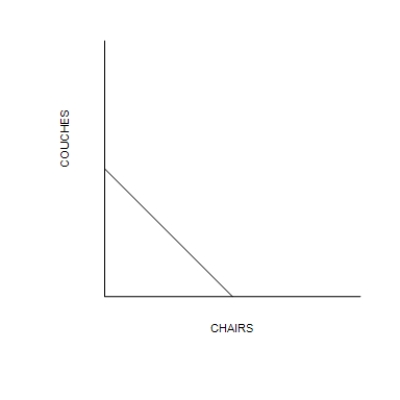
-Refer to Figure 3-1. The rate of trade-off between producing chairs and producing couches depends on how many chairs and couches are being produced in
A) Graph (a) only.
B) Graph (b) only.
C) both Graph (a) and Graph (b) .
D) neither Graph (a) nor Graph (b) .
Correct Answer:
Verified
Q142: Table 3-7
Barb and Ren run a business
Q143: Table 3-7
Barb and Ren run a business
Q144: Figure 3-2 Q145: Figure 3-2 Q146: Figure 3-1 Q148: Figure 3-4 Q149: Figure 3-4 Q150: Table 3-8 Q151: Table 3-9 Summary of the Gains from Q152: Table 3-8 Unlock this Answer For Free Now! View this answer and more for free by performing one of the following actions Scan the QR code to install the App and get 2 free unlocks Unlock quizzes for free by uploading documents
![]()
![]()
Graph (a)
Graph (b)
![]()
![]()
![]()
![]()
![]()

