Multiple Choice
Figure 1 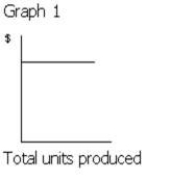
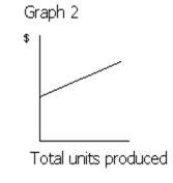
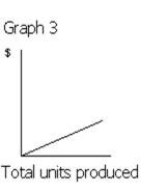
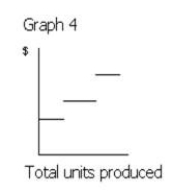
-Which of the following graphs in Figure 1 illustrates the behavior of a total fixed cost?
A) Graph 2
B) Graph 3
C) Graph 4
D) Graph 1
Correct Answer:
Verified
Related Questions
Q50: If the volume of sales is $6,000,000
Q51: Only a single line, which represents the
Q54: The reliability of cost-volume-profit analysis does not
Q60: Cost-volume-profit relationships in a service company are
Q63: Which of the following activity bases would
Q65: Most operating decisions of management focus on
Unlock this Answer For Free Now!
View this answer and more for free by performing one of the following actions

Scan the QR code to install the App and get 2 free unlocks

Unlock quizzes for free by uploading documents